Daniel J. Boorstin
The trouble with labels is that they are sticky. Take a concept that has served us very well in NLHE theory, ‘dry’ and ‘wet’ to describe how many viable draws exist on the flop. Whilst NLHE flops are identical to PLO flops, porting the labels we apply to those flops from one game to the other is a mistake. The additional hole cards in PLO make even minor straight draws a far more significant part of every player’s range. If you retain these labels in your flop reading then you have an ‘illusion of knowledge’. Such illusions are so threatening because when we evaluate our play we rarely challenge our premises. Flop categorization is one of the most fundamental premises any practical poker line can be built on.The following exercise and subsequent discussion will help dispel this particular illusion.
Sort the following twelve trichrome textures into groups of similar ‘dryness’. You’ll need a pen and paper to get the most from this exercise, since you can’t cheat yourself once the ink is dry.
- Q♣7♦2♠
- Q♣7♦4♠
- Q♣J♦2♠
- K♣J♦8♠
- 8♣4♦2♠
- J♣7♦3♠
- J♣7♦2♠
- 9♣5♦2♠
- K♣5♦3♠
- K♣T♦6♠
- J♣T♦2♠
- K♣T♦5♠
Done? Let’s see how well you did…
If your poker instincts were honed in Hold’em you probably chose similar arrangements to me the first time I did this exercise, namely: Dryest: {1, 2, 5, 6, 7, 9} Dry: {3, 8, 11, 12} and Wet: {4, 10}.
Type Transitions
The number of turns which introduce a straight to a previously 0-straight flop is the most significant factor in our assessment of the fluidity of a trichrome flop. When you count these you discover that every 0-straight flop in PLO falls into one of 5 categories: {0%, 25%, 33%, 41%, 49%} probability of turning 1 or more straights. The smallest category is the 0% set, which at a 1.1% width contains only 4 members {K83,K82,K72,Q72}. The 25% set contains 14 members, with a total width of 3.8%. Using the “Type Transition” metric, the textures above are members of the sets as listed below:
0%: {1}
25%: {7}
33%: {2, 12}
41%: {3, 4, 5, 9}
49%: {6, 8, 10, 11}
Naturally we are most interested in the ‘illusions’, those textures where our poker intuition has led us astray. Your approach to Q♣7♦2♠ and Q♣7♦4♠ is likely the same and yet the latter has a 33% chance of harboring a straight by the turn whereas the former never does. Similarly dramatic is the doubling in potential straight transitions from J♣7♦2♠ to J♣7♦3♠. It seems astonishing that K♣5♦3♠ should have the same draw potential as K♣J♦8♠ but the numbers don’t lie… Or do they?
In defense of intuition
Our analysis thus far has neglected a fairly important feature of the poker game, namely a player’s hand. The simple metric above weights a turn card that brings a gut-shot equal to that which completes the ‘obvious’ open-ended straight draw. We can tune the metric by counting the number of available 2-card and 3-card 8+ out draws possible on the flop.
| Flop | Turn Straight % | 2C ODs | 3C ODS | 3C Enumerated |
| J♣T♦2♠ | 49% | 3 | 1 | AQ8 |
| K♣T♦6♠ | 49% | 1 | 6 | Q98,Q97,J98,J97,J87,987 |
| 9♣5♦2♠ | 49% | 1 | 5 | 876, 864, 863, 764,763 |
| J♣7♦3♠ | 49% | 0 | 2 | T98,654 |
| Q♣J♦2♠ | 41% | 2 | 1 | AT8 |
| K♣J♦8♠ | 41% | 2 | 1 | AT7 |
| 8♣4♦2♠ | 41% | 2 | 1 | A75 |
| K♣5♦3♠ | 41% | 2 | 0 | |
| Q♣7♦4♠ | 33% | 1 | 0 | |
| K♣T♦5♠ | 33% | 1 | 0 | |
| J♣7♦2♠ | 25% | 0 | 1 | T98 |
| Q♣7♦2♠ | 0% | 0 | 0 |
This metric is powerful because we already know that each 2-card combination occurs with a 6.5% frequency in an Omaha hand and each 3-card combination 1% of the time
You can’t see what you’re not looking at
The ‘Turn straight %’ is a fine metric of how threatening the board is to anything except a set. On most textures, especially in 2-bet pots with wide ranges, sets are a tiny fraction of our overall range. Thus an opponent with {pair + gutter} is almost as threatening as one with an open-ended straight draw. On the J♣7♦3♠,T976 has 49% equity against AA and JT98 only 46%. The illusion on these textures is that your flop made hand value is of significance. What actually matters is your river range and how you arrive there. The reason it is so much easier to construct flop ranges in NLHE than in PLO is because flop made hand strengths are strongly coupled to river made hand strengths in NLHE. This insight has huge implications on bet sizing and protecting checking ranges on every one of the boards listed at the top of the article. How this insight changes our betting strategy is a tale for another time…
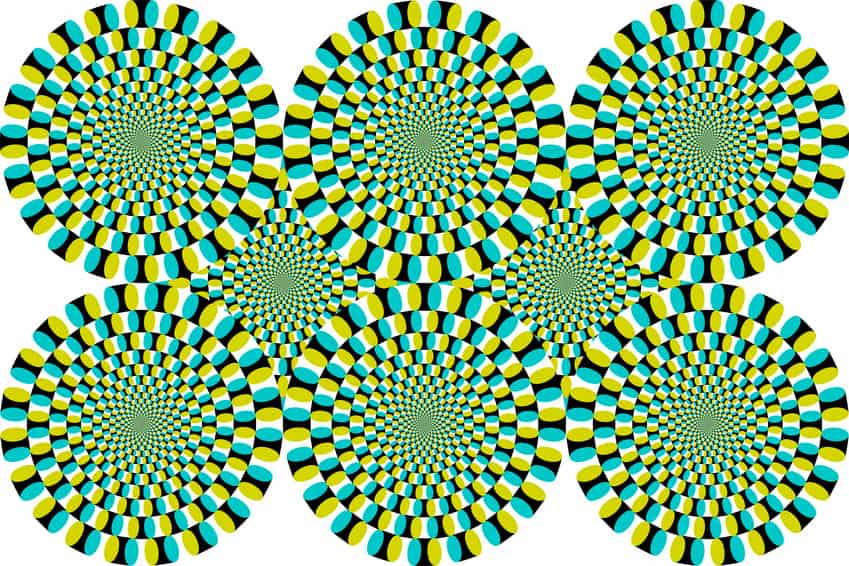
Your eyes are fine, the image at the top isn’t moving, it only looks like it is. Good luck at the tables,
Quad


Great article, I almost nail the exercise.
Hi Phil,
Great stuff as always. Do you plan on making a post on how each of these boards affects bet sizing and checking ranges? If not could you touch on it here?
Thanks
Hi Brad,
I can’t write a single post on that topic but I could write a book on it!
Rather than just leave you with that, I’ll explain why: Pre-flop ranges have a huge impact on which of these boards have significant ‘viable draws’ on them. This in turn impacts the appropriate bet sizing. If you open the button in a Heads-up game and your opponent calls very wide in the Big Blind then the K53 and the KJ8 really do have similar bet sizing considerations. If your opponent opens from UTG in a 6-max game and you 3-bet from the BB then the draws on the KJ8 are crucial and those on the K53 virtually irrelevant.
There are many other factors at play: SPR, opponent’s donking range, XR/XF tendencies (and this list isn’t exhaustive). The main point of this article is to stop you using the same bet size on the flop across all textures because flop families from NL are generally ‘false friends’ when playing PLO.